ROI Calculator
- Home
- ROI Calculator
Assisting our customers with
The cost benefits of switching to robotics
The return-on-investment (ROI) calculator illustrates the potential cost savings of using a robot automation system compared to manual labor operation over a 15-year time period.
How to use the ROI calculator
To use MWES’ ROI calculator, you first need to factor in a number of variables based on your current operation: the total number of workers currently employed that operate the current system, the number of hours a day and days per week that the operation runs, and the average yearly wage of each operator. Next, you need to enter the total cost of the robotic system that’s replacing the manual operation, including the total number of robots that the system utilizes. And finally, you need to factor in the expected productivity gain that is expected from switching over to robots from manual labor, 20-30% is typical.
Understanding the results
The results basically represent the cost of manual labor vs the cost of a robotic system doing the same work. The Robot Operating Cost is the total cost of running each robot factoring in the yearly electric bill which is typically around $1 per hour and the regular maintenance along with 5-year refurbishments. Labor Savings is strictly the cost of the total annual wages of all the operators working the current system which can range from $16 to $30 per hour. Productivity Savings represents the added costs and work loss of manual labor, such as breaks, illnesses, labor shortages, etc. All of this translates to Yearly Returns that take the total cost of the robotic system and the yearly robot operating costs and subtracts the Labor Savings and Productivity Savings. The year-to-year results account for the 5 and 10-year robot refurbishments and the yearly 2% increase in inflation costs.
This calculator is intended for informational purposes only. The final amounts are estimated.
Investment After 15 Years
| Year | Robot Operating Cost | Labor Savings | Productivity Savings | Yearly Returns | Cumulative Returns |
|---|---|---|---|---|---|
| Loading Data... | |||||
Adds an assumed 2.4% average inflation rate year over year.
The GREEN line represents the savings of utilizing robotic automation in place of manual labor.
Alternatively, the RED line represents the cost of manual labor over that same stretch of time.
The ROI calculator gives the user a rough estimate of how cost-effective robotic automation is in the long term versus a manual operation. If you feel robotic automation can improve your operation, please get in touch with us today. Our Applications Engineers can help you through the process and provide you with more detailed information as to what returns you should expect.
Building the future of manufacturing, together
How we can help your business with
The MWES Process
Our Process
With each automation project, Midwest Engineered Systems implements a project management process that walks through the steps for successful equipment integration.
Process Development
Our approach to automation process development is to first evaluate the firm’s current production operation and understand the company’s process needs.
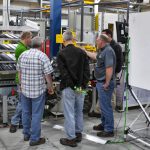
Proof of Principle Testing
We offer the ability to experience the performance of an automation system with real parts and production conditions before significant investment in a production automation system is made.
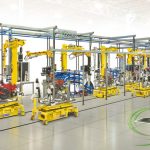
Consolidating Multi-Line Production
We can utilize our depth of knowledge on facility-wide automation projects to analyze the current production system to build the best automation solution.
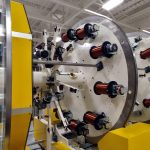
Engineering for Manufacturability
We can help reduce the costs associated with automation by analyzing and suggesting product and process modifications.
Why work with us
A trusted partner in manufacturing
Team Members
100+
Systems Built
4,000+
facility sq. feet
100,000+
RIA Robot Experts for
12 years
The latest updates from MWES
Blog & News Articles
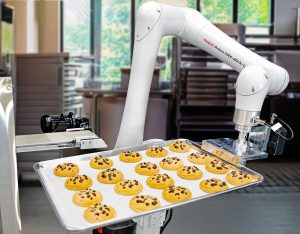
MWES to Debut Baking Cobot Platform at IBIE 2025
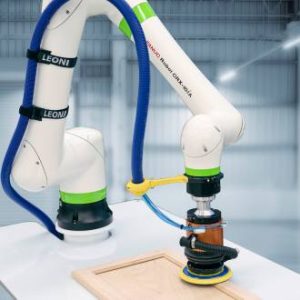
Cobots: Why the Full Application Determines Safety and Success

Why Doesn’t Your Automation ROI Add Up? Look Upstream

AS/RS Buffer Systems: Warehousing on a Whole New Level
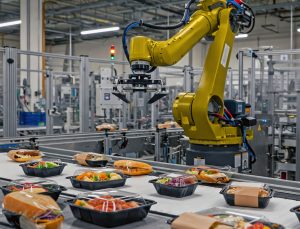
Food Industry Automation: More Than Just Labor Savings
Robotic Automation is Revolutionizing the Food Packaging Industry
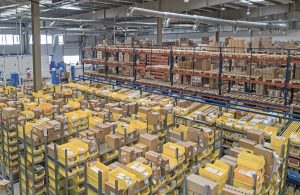
Frontload Your Inventory with Automation: A Strategic Approach to Tariff Preparation
Join Us at One of Five Exciting Tradeshows This Year
